Beyond Auto Manufacturing
Executive Summary
- EV sales are expected to pick up over the next two decades as many of
the key consumer issues – price, range and charging – are addressed. - Estimates are that EV penetration in Europe could reach 40% by 2040 – a
fleet of 120 million. - Charging behaviour is likely to favour overnight charging due to
convenience and driving behaviour (“smartphone” model). - Around 115 million chargers will be required in Europe in 2040 with the
bulk being overnight chargers – fast chargers at filling stations will be a
minute fraction of this (0.1%). - The bulk of capital will need to go to overnight – kerbside/car park
chargers. - Utilities are the best placed to handle the charging network rollout and it is
unlikely to significantly strain their capex. - Issues with electricity demand will come on the local level and utilities are
once more able to keep up with the required reinforcement spending. - Potential improvements to balancing the grid could reduce the spending
requirements further: Vehicle-To-Grid is a new and exciting prospect that
could also boost revenue for utilities. - Oil demand is barely affected by EVs currently, but this may change and
EVs in Europe could displace 10-20% of oil demand in 2040. - Lack of filling station demand and a rise in mobility services could put the
value that oil companies gain from Marketing at risk: >$100bn across the
7 major oil companies in Europe. - Lithium-ion batteries are the main factor in the greater purchase price of
EVs over petrol/diesel vehicles but are reducing in cost and improving in
range rapidly. - Supply shortages for some of the main commodities in batteries suggest
that demand will outstrip supply in the next decade, causing greater
consolidation in the industry and potentially slowing the price declines. - Solid-state batteries are the future in terms of energy density and cost but
are unlikely to be mass produced till the end of the next decade. - EVs are almost universally better for the environment than petrol/diesel
vehicles
1 Introduction to Electric Vehicles
1.1 History & Resurgence
‘Revolutionary’ technologies have been abundant in the last century. The internet,airplanes and antibiotics have paved the way for individuals to live longer, healthierand more connected lives. The electric vehicle (EV), whilst certainly holding similarpromise, differs from them in the respect that it was not invented in the 20th century.Accounts of the first EV’s inception can be traced back to as early as 18841. After a golden age in the 1890s and early 1900s, the EV was soon superseded by the cheaper, longer-range internal-combustion-engine (ICE), popularised by Henry Ford, and many consigned it to the same fate as the steam engine.
This view turned out to be misguided. Far from becoming obsolete, EVs are now considered the obvious future of transport. This meteoric rise is not only due to the development of battery and materials technology, but also owes its existence to an increasingly climate aware society. EVs produce no air pollutants and can contribute less than half the CO2 that an equivalent gasoline car would over its lifetime, even when manufacturing is considered (see Appendix).
With governments implementing EV friendly regulation and technological developments easing past concerns, individuals are more inclined than ever to
purchase EVs. In national surveys, 10-30% of consumers in the US indicated a preference for an EV as their next purchase2 . This figure rises to 40-60% in Europe and close to 70% in China2 (albeit with strong government incentives). The UK Government has stated that it intends to halve the number of gasoline cars on the road by 2030 and ban them from 20403 . Recently, it proposed legislation to introduce mandatory charging points in new homes built in the UK4.
1.2 Consumer Issues
However, consumer issues still exist and can be categorised into 3 main areas:
1)Range: the current average range for a fully electric vehicle is 100-200km; more expensive models can stretch this to over 500km5 . While this is comfortable for most daily commutes, drivers become uneasy when undertaking longer trips and would be more disposed to using a hybrid or gasoline vehicle.
2)Charging infrastructure: lack of range adds concern over the availability of charging points. There are currently 23,450 (June 2019) charging points in the UK6. Along with the number of charging points, the speed of charging is an issue. The 6-8 hour charge times that typical home chargers provide is woefully inadequate for on-the-go charging analogous to a petrol refill. ‘Rapid’ chargers – that can provide an 80% charge in 30 minutes – are still few and far between, making up about 1,500 chargers7
- The Telegraph –
https://www.telegraph.co.uk/news/newstopics/howaboutthat/5212278/Worlds-first-electric-car-built-by-Victorian-inventor-in-1884.html - McKinsey & Co –
https://www.mckinsey.com/industries/automotive-and-assembly/our-insights/making-electric-vehicles-profitable - Parliament –
https://publications.parliament.uk/pa/cm201719/cmselect/cmbeis/1881/188102.htm - Gov.Uk –
https://www.gov.uk/government/news/electric-car-chargepoints-to-be-installed-in-all-future-homes-in-world-first?utm_source=225e608b-79af-4f50-ba3d-d2e1e38881f8&utm_medium=email&utm_campaign=govuk-notifications&utm_content=immediate - Clean Thechnica –
https://cleantechnica.com/2018/10/27/us-electric-car-range-will-average-275-miles-by-2022-400-miles-by-2028-new-research-part-1/ - Next Greencar –
https://www.nextgreencar.com/electric-cars/statistics/
3) Price – EVs continue to be more expensive to buy than gasoline vehicles, primarily due to battery costs. However, an often overlooked cost is for maintenance and service in which EVs are 23% cheaper than petrol vehicles over a 3 year/60,000 mile period8. A large part of this is due to the lack of an engine – a key contributor to servicing costs for gasoline vehicles.
These issues are affecting a variety of industries. Charging infrastructure and the electrical distribution requirements around it are having material impacts on electricity grids. Big Oil is beginning to look more seriously into the scale of the threat from EVs and how they can adapt. Improvements in batteries and other components involved in EVs are helping depress prices.
1.3 Future Projections
As these concerns diminish, EV sales are expected to pick up. Global EV sales are projected to grow from over 2 million in 2019 to almost 65 million in 20409(Figure 1). In Europe, the cumulative EV fleet is expected to reach 120 million by 20409 (Figure 2: Cumulative number of EVs on European roads. Source: Bloomberg), with a penetration of 40%10 (Figure 3).
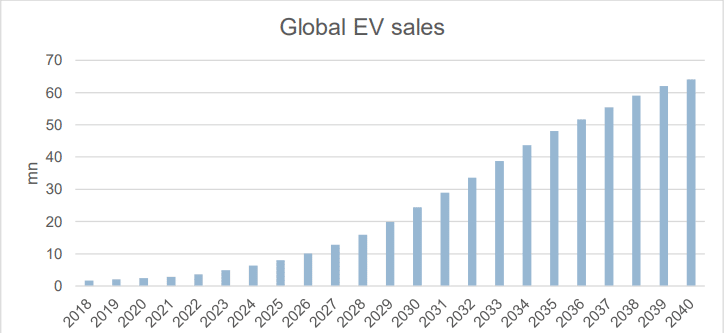
Figure 1: Global annual EV sales projections. Source: Bloomberg
- Zap-Map –
https://www.zap-map.com/statistics/ - Motoring-Reasearch –
https://www.motoringresearch.com/car-news/cheaper-servicing-electric-car/ - Bloomberg –
- BAML:Electric Vehicle Charging(From Pump to Plug)
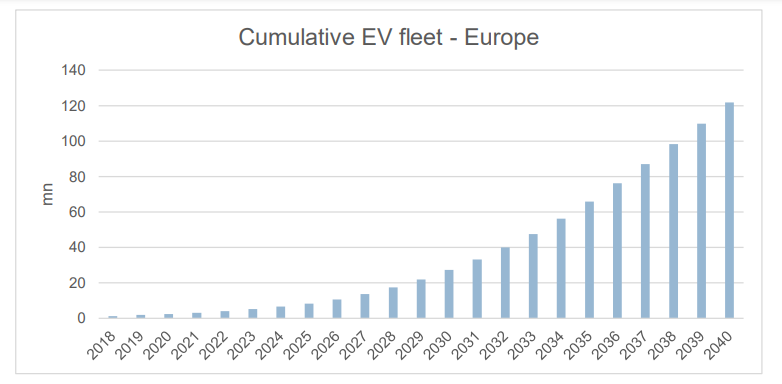
Figure 2: Cumulative number of EVs on European roads. Source: Bloomberg
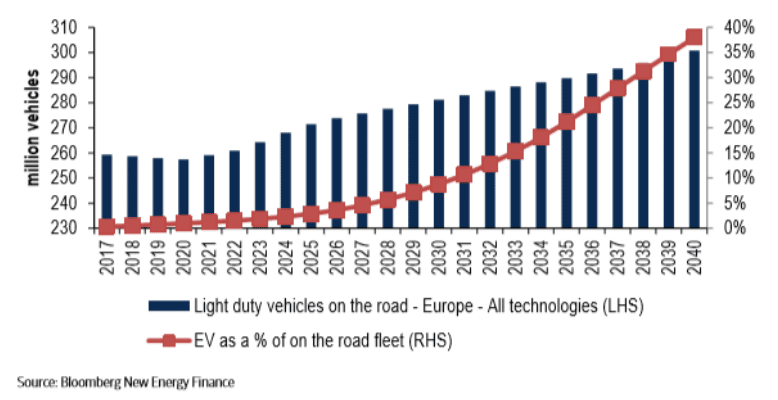
Figure 3: EV penetration forecast in Europe. Source: BAML
2 Charging Network
2.1 “Smartphone” Model
A natural starting point for tackling consumers’ problems is building a sufficient charging network. A model for charging behaviour is dubbed the ‘smartphone’10 model – motorists primarily charge their vehicles close to home, overnight, plugging them in almost every time they return home. This is analogous to the way most users charge their smartphones. The arguments in favour of this model are:
1) Convenience: this model almost eliminates the need to spend time actively charging the vehicle and the car is always fully charged in the morning
2) Driving patterns make fast chargers less necessary: in the UK, 94% of single journeys are less than 25 miles10. When compared with currentranges of EV models, this is unlikely to be a significant barrier
3)Cheaper: charging at home circumvents ‘middlemen’ costs incurred at public charging/filling stations. Furthermore, electricity is likely to be
cheaper at night owing to time-of-use tariffs.
4)Battery wear & grid stability: repeated fast charging will place excess strain on batteries. Overnight plugging may also have benefits to stabilising grid demand and so might be incentivised further by governments or utilities.
2.2 How many chargers are required?
Using a combination of EV sales projections and some assumptions aboutconsumer charging behaviour, BAML produced a projection for the number of
chargers required in Europe, broken down by type and location10 (Figure 4).
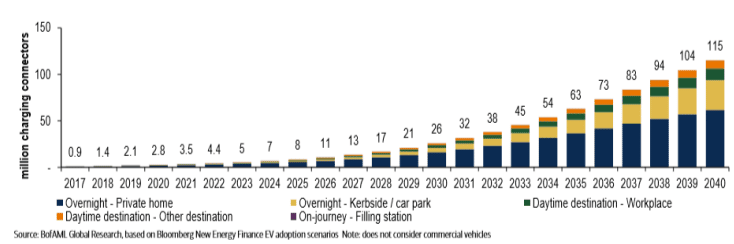
Figure 4: Number of EV chargers required in Europe. Source: BAML
There are a couple of points of note in this graph. Firstly, the share of ‘overnight’ charging points dominates the total. Secondly, the number of ‘filling station’ charging points is negligible (unobservable on the graph). This corroborates the ‘smartphone’ model outlined previously (Figure 5).
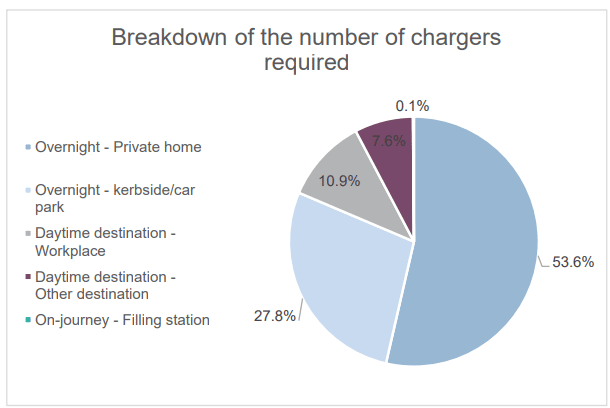
Figure 5: Breakdown of chargers by type in 2040. Source: BAML
The feasibility of this kind of rollout can be determined by splitting the network up into private and public chargers. Figures from Berg Insight show that 28 million smart electricity meters were installed in Europe in 201711; although EV chargers are more difficult to install, the 6 million private charger installs required per annum in the 2030s (Figure 6) seems easily achievable10.
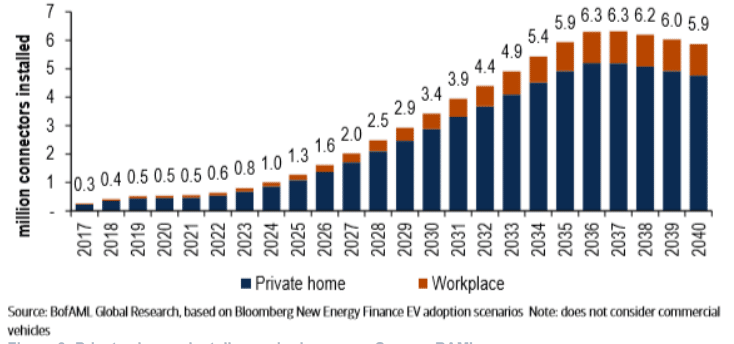
Figure 6: Private charger installs required per year. Source: BAML
It is slightly trickier to find comparative infrastructure for public chargers. A coupleof possible options are new fixed line telecoms connections (an average of 6 million installs per year from 1981-199810) and new gas connections (a total of 1.7 million connections were added per year based on a sample of years in the 1990s and 10 European countries10). BAML estimates that public charger rollout will be slow in the near future – as they assume new EVs will be disproportionately bought
- Berg Insight
by people who are able to park them on their own land – but will eventually pick up to rates similar to private chargers (Figure 7), almost 5 million chargers per yearby 204010.
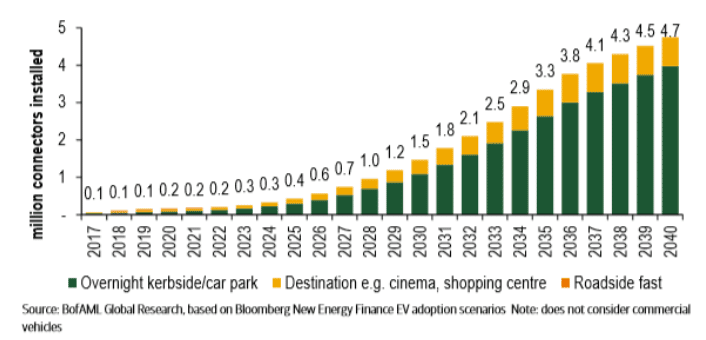
Figure 7: Public charger installs required. Source: BAML
Therefore, there does not seem to be any bottleneck to a charging network rollout in Europe on a technical infrastructure level.2.3 Cost
On a cost level, BAML has combined data for the cost of each charger by type/location over time with their data for charger uptake to come up with an estimate for annual total expenditure required on charging points in Europe 10 (Figure 8).
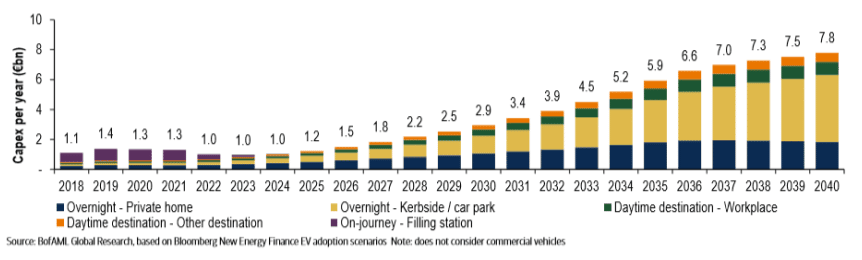
Figure 8: Annual total spend on charging points required in Europe. Source: BAML
The two takeaways from this graph are a) higher spending is expected over the next few years, skewed towards the ‘filling station’ fast chargers and b) the largest
growth in expenditure is seen in overnight – kerbside/car park chargers, which eventually dominate total spend (Figure 9). The first point is because rollout is expected to be ‘front-loaded’ as fast chargers have much higher unit costs than other charger types (roughly €30,000 per charger compared to €2,000 for kerbside/car park chargers and €700 for private chargers10) – this is mainly due to the significantly larger power required by them and their location in highly travelled areas. The second point can be explained by the slow initial uptake of public chargers followed by their catch up to private charger installs along with their relative cost. The factors behind these cost figures come from current data from their various suppliers along with a seemingly arbitrary forecast as to how their costs will decline. The cumulative cost of this across Europe is expected to be around €80bn by 204010
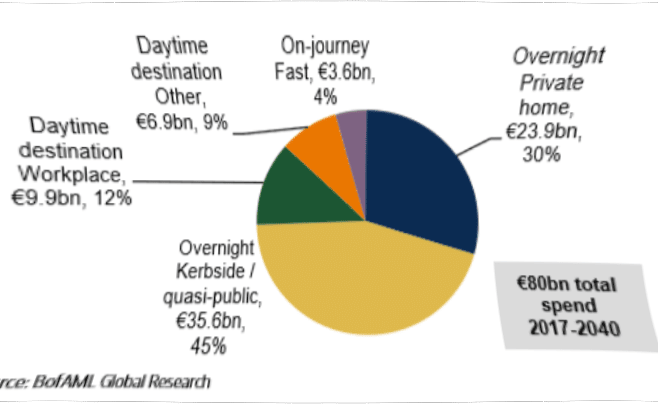
Figure 9: Breakdown of total spend on chargers. Source: BAML
However, it is worth noting the variability in these estimates – the range of outcomes from BAML are €40-140bn of total spending by 204010. This is due to the differences in how the cost per charger changes with time as well as the uptake of chargers themselves. Regardless, even the low-end €40bn figure is not insignificant.2.4 Utilities are the best placed
The ability to meet this scale of investment is well achievable by utilities companies. Utilities have big enough balance sheets, the expertise to take on
large long-term infrastructure projects and can integrate the chargers into the electricity networks most efficiently. Furthermore, their highly regulated nature means that they naturally extend the existing governmental regulations preventing monopolisation, which may be expected given the likely ubiquity of charging points in the future – particularly public ones. Private chargers will likely be financed by the energy suppliers as opposed to the network operators as they are the ones currently providing smart/gas meters.
An example of this can be seen with Scottish and Southern Electricity (SSE), which is a regulated electricity distributor in the UK. By using the percentage of Europe’s ‘Regulated Asset Base’ (RAB) – the conventional measure of their network infrastructure assets – owned by SSE and combining it with the expenditure
figures above as well as SSE’s capex figures, I’ve made a rough guide to the impact of a public – kerbside/car park charger rollout on SSE’s capex (Figure 10) 12.
There are many assumptions in this forecast – the consistency of SSE’s RAB relative to Europe’s, annual capex increases in line with inflation (3%), base case
BAML figures – but it shows that such a rollout of public chargers is unlikely to significantly affect the company: annual incremental capex would only be 4% ofSSE’s Networks business capex (not their whole business) in 2040. Even if SSE were to invest in all types of chargers in its areas (it is also an energy supplier as it has some retail customers), this figure only increases to 8.5%12.
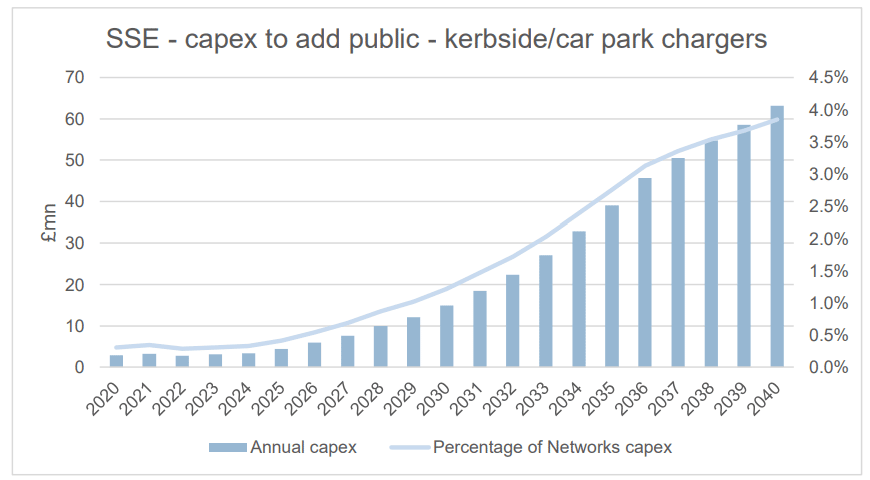
Figure 10: Capex requirements on SSE to rollout public – kerbside/car park chargers. Source: BAML, SSE Annual Reports
Hence, it is reasonable to assume that providing the required charging network should not be a hindrance in the future. Whether this opportunity is taken on by
utilities is unclear but there are some logical reasons why they are well placed to do it. Barriers to entry in this sphere will likely remain high due to the high level of capital and regulatory expertise required as well as economies of scale advantages enjoyed by the incumbents. It is possible that the largest bottleneck to this uptake will be a bureaucratic one – regulation and support will need to be given at a fast pace to permit the desired improvements.
- SSC:Annual Reoorts
3Electricity Distribution
3.1 The Grid
As more EVs enter the charging network, a greater demand will be placed on the infrastructure providing the electricity. The ‘grid’ is the term given to the collective infrastructure that takes electricity generated from power stations and transports it to our homes. It consists of high voltage transmissions lines, which move the electricity across long distances, connected to local substations and low voltage distribution lines that then dispense it on a local level13 (Figure 11: General form of the electricity network. Source: Solar Schools). In the UK, the high voltage transmission lines are wholly owned by National Grid whilst the low voltage distribution lines are owned by an oligopoly of six companies known as the ‘Big Six’ Distribution Network Operators (DNOs)14 (Figure 12). All of these companies are highly regulated. The DNOs then sell their electricity to energy suppliers like OVO and Octopus whom consumers pay for their power.
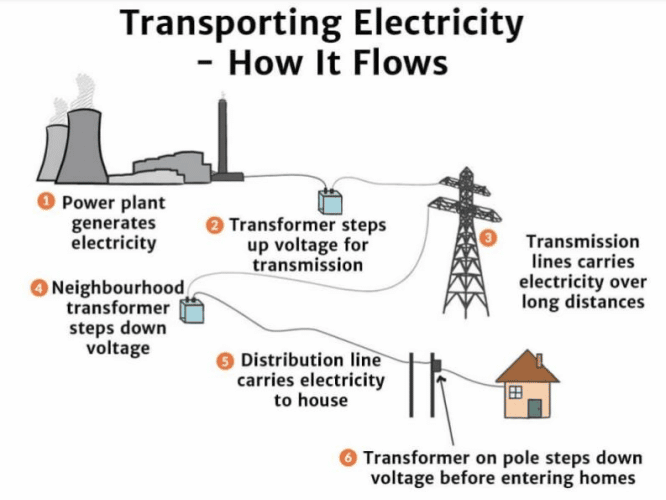
Figure 11: General form of the electricity network. Source: Solar Schools
- Soler School :
https://www.solarschools.net/knowledge-bank/energy/electricity/flow - OVO Energy :
https://www.ovoenergy.com/guides/energy-guides/dno.html

Figure 12: Big Six DNOs in the UK. Source: OVO Energy3.2 Grid reinforcement
The problem of excess demand will come at the local, as opposed to national, level. Analysis from McKinsey states that EV growth into 2030 will add roughly 1%
to total capacity (5GW); this moves to only 4% (20GW) by 205015 (using Germany as an example). By contrast, the non-uniform distribution of EVs across a country will cause local distribution networks to see their capacity exceeded at peak times – this is best illustrated by the ‘load’ curve (the variation in electricity demand over the day) (Figure 13). A typical residential circuit supplying 150 homes at 25% local EV penetration could have local peak loads accentuated by as much as 30%15. A single household’s peak demand could double15.
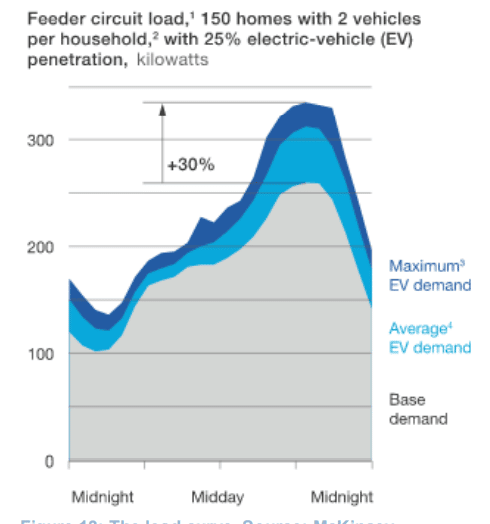
Figure 13: The load curve. Source: McKinsey
The key cost in the required upgrades will be the transformers in the network. The My Electric Avenue (MEA) study concluded that 32% of the UK low voltage distribution network would require intervention in a 40-70% EV penetration scenario for 3.5kW charging16. Based on estimates of European electricity demand, BAML created a rough projection of the cumulative grid spending needed10 (Figure 14).
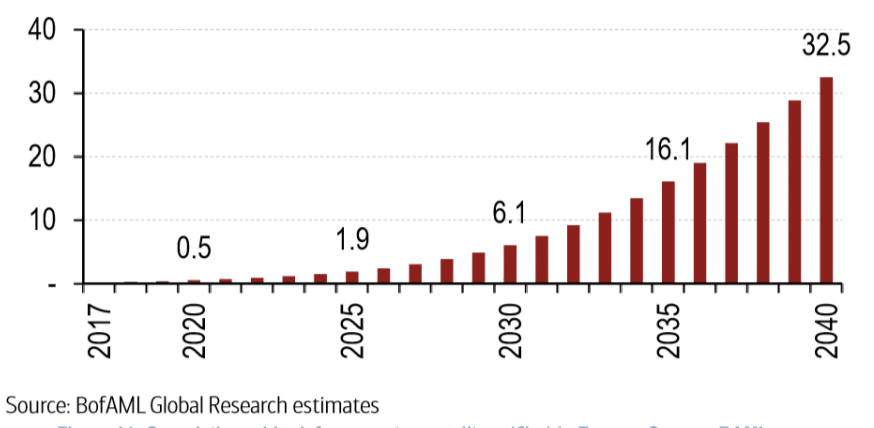
Figure 14: Cumulative grid reinforcement expenditure (€bn) in Europe. Source: BAML
This figure of ~€30bn by 2040 is approximately 10% of Europe’s current total RAB10. For the UK, it scales to about £5bn by 2040 on a current RAB of £25bn – about 20%10. This was calculated by taking into account the percentage of transformers in the European grid that are in the UK (15%).10. Hence, it is unlikely that the capital required to facilitate the electrical grid infrastructure necessary will be a bottleneck to EV uptake.
- My Electric Avenue :
http://myelectricavenue.info/sites/default/files/documents/Summary%20report.pdf
3.3 Potential Solutions
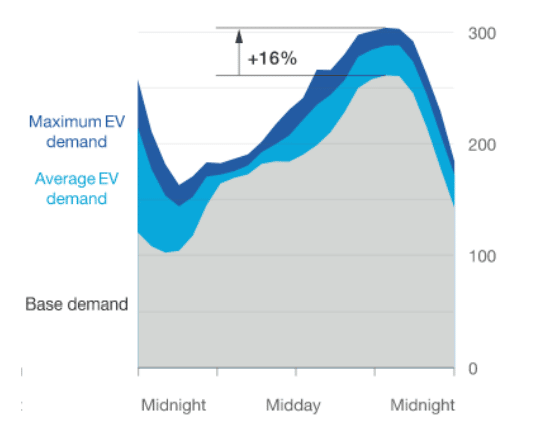
Figure 15: The load curve with ToU rates (kilowatts). Source:McKinsey
Potential solutions also exist to bring down these upgrade costs further. Time of use (ToU) tariffs provide incentive schemes to consumers to charge when demand is low and has the potential to half the peak load increase17 (Figure 15). Smart charging – autonomously turning charging on and off to help balance the demand on the grid – could save £2.2bn of grid reinforcement in the UK by 2050 according to MEA16 . This is a considerable amount in the context of the projections made above.
A more distant but highly beneficial possibility is Vehicle-to-Grid (V2G) – this is the ability to reverse the usual direction of energy in a charger so that the grid can provide electricity to the car and the car can also give it back to the grid. Currently BAML expects that the incremental cost to energy suppliers to add this capability to current private chargers will be roughly £320 (£170 due to adding the necessary components to the charger and £150 for potential R&D and grid connection)18. Based on the data provided earlier on the potential charger rollout and the current basic private charger cost of £71418, V2G technology could add approximately 50% to the total capital expenditure required for chargers in Europe up to 2040, bringing the figure to €120bn18. This assumes that the cost to add V2G to different types of chargersscales with their base price.
However, there is also a potential revenue stream available for energy suppliers. BAML estimates that the most likely model for monetising V2G is energy suppliers controlling multiple EV chargers and creating a “virtual power plant” to sell electricity back to the network operators over the daysup>18 – this is more plausible than the complex procedure of individuals programming their own chargers to buy and sell electricity during the day depending on its price. Using electricity prices (UK and Germany), electricity outputs from different vehicles and varying levels of car usage, BAML estimates that suppliers could get payback on the cost of V2G chargers in 4 years whilst providing electricity to the consumer for free18. This would mean that the consumer pays nothing for fuel costs but gives all of the earnings from selling their car’s electricity to their electricity supplier – about £80 per annum per V2G charger net of costs18. Based on the charger installation estimates, this could generate €10bn per annum by 2040 for European utilities18.
- McKinsey :
https://www.mckinsey.com/industries/automotive-and-assembly/our-insights/the-potential-impact-of-electric-vehicles-on-global-energy-systems - BAML:Vehicle-To-Grid(From Pump to Plug )
3.4 Decentralisation
Along with transformer upgrades, a broader shift to the grid infrastructure comes from the increasing prevalence of renewables. Historically, the UK has used a
centralised network of power generators and demand data to ensure that electricity is delivered as and when it’s needed. Uneconomical battery technology prohibited mass storage and fossil fuels were the prevalent source of energy, requiring this form of deliver-on-demand service. However, this model is slowly evolving. The combination of cheaper batteries and more advanced renewables is creating a decentralised network of energy production 19 (Figure 16). Now, individual households can sell energy, which they may have built up via solar panels, back to the grid. If V2G becomes widely available, this shift will only accelerate. It is difficult to assess the extent of the impact on grid infrastructure, as the total amount of energy flowing through it will only be affected by demand as opposed to the source of the supply, but it is likely that some upgrades will be required to facilitate better local distribution.
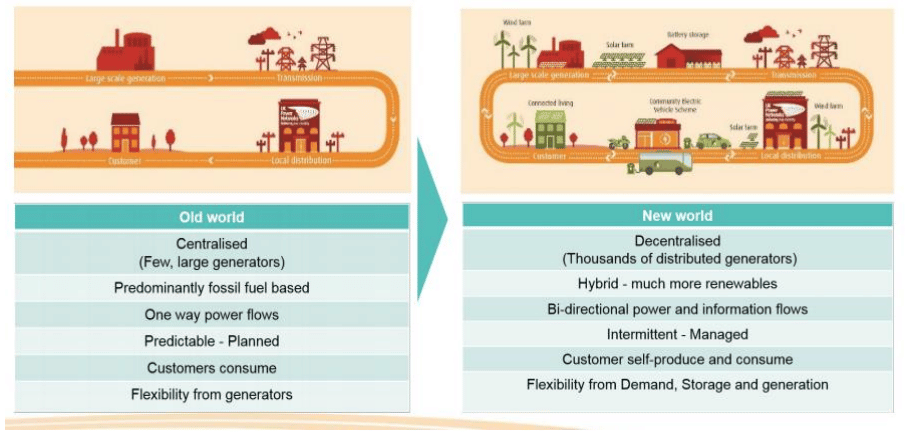
Figure 16: Shift in grid infrastructure. Source: UKPN
3.5 Can utilities cope?
National Grid
How will these capex requirements impact National Grid? BAML have made a very illustrative forecast on annual excess grid expenditure requirements for Europe due to EVs10 and these can be roughly scaled to the requirements for National Grid
by using its UK RAB as a percentage of the total in Europe – about 6%20. If I assume that National Grid’s UK capex increases at inflation (3%), an approximate idea of how much incremental spending will need to be done due to EVs can be forecast (Figure 17)
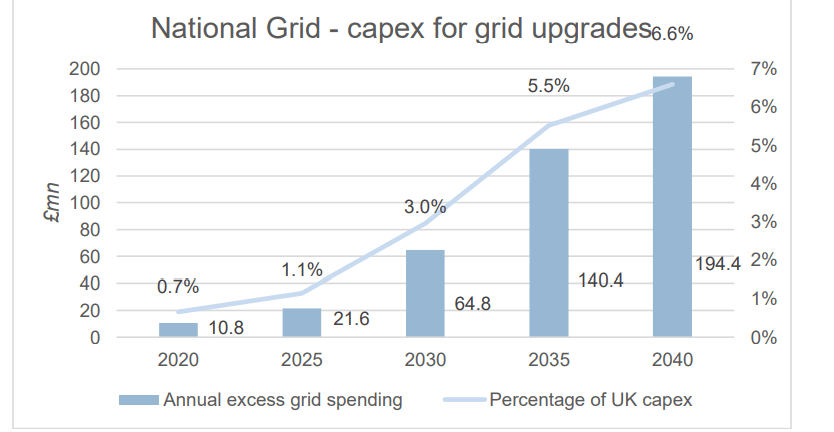
Figure 17: National Grid capex requirements for grid upgrades. Source: National Grid Annual Reports
These figures are extremely basic but give a simple idea of the scale of investment required on National Grid’s part – this is in line with management’s expectations that it would cost “several hundred million dollars to connect all the key service stations in the UK”21. It also supports the findings from BAML of the relatively mild impact grid upgrades will have on network spending.
Similarly, its effect on National Grid’s top line is not particularly significant. Based on the common RAB model of regulation, BAML estimates that about 11% of
investment into the grid is converted into revenue10 – this includes provisions for an initial annual return on capital, an annual depreciation allowance and an annual opex allowance. Therefore, the incremental revenue gained by National Grid from these grid upgrades can be projected to be just over £20mn in 2040 – National Grid earned close to £15bn in 201920.
SSE
A similar analysis can be conducted for SSE, whose share of Europe’s RAB isroughly 2%12. As it spends more capex relative to its RAB than National Grid, the incremental cost of grid upgrades is even smaller for SSE (4%).
- National Grid:Annual Reports
- National Grid:Q2 2018 Earnings
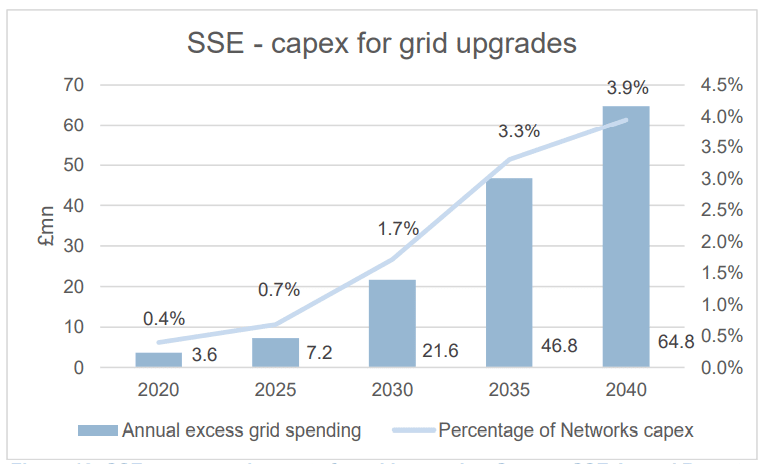
Figure 18: SSE capex requirements for grid upgrades. Source: SSE Annual Reports
Scaling the figures from BAML to SSE’s RAB, the capex requirements for SSE to fulfil this is small (Figure 18) but it would provide crucial infrastructure to facilitate
the adoption of EVs.
Similar to the charging network, the necessary grid infrastructure seems to be an achievable objective, even though it is likely to change the nature of electricity distribution a lot. As potential solutions help to smooth out the load curve, the demands on the grid should be within the capabilities of its supply.
4 Big Oil
4.1 Oil demand displaced
Currently, EVs do not displace a significant amount of oil demand. Roughly 100 million barrels of liquid oil and gas are demanded globally per day22 compared to the 50,000 daily barrels displaced by EVs23 . A primary cause of this is that passenger vehicles only make up about a third of oil demand24. Petrochemicals, freight and aviation contribute a large chunk of oil company revenue and there is little sign that this will diminish in the near future. Electricity still falls comprehensively short of meeting the requirements that these industries have.
However, this is likely to change in the long term. BAML have come up with an approximate forecast of electricity consumption from the EV industry using projections for EV sales and factoring in their increased efficiency (they use ~60% less energy than ICE vehicles10), population growth and greater ride sharing. Using this data and simple conversion rates between energy and barrels of oil, I have forecast how many barrels of oil per day EVs in Europe may displace (Figure 19).
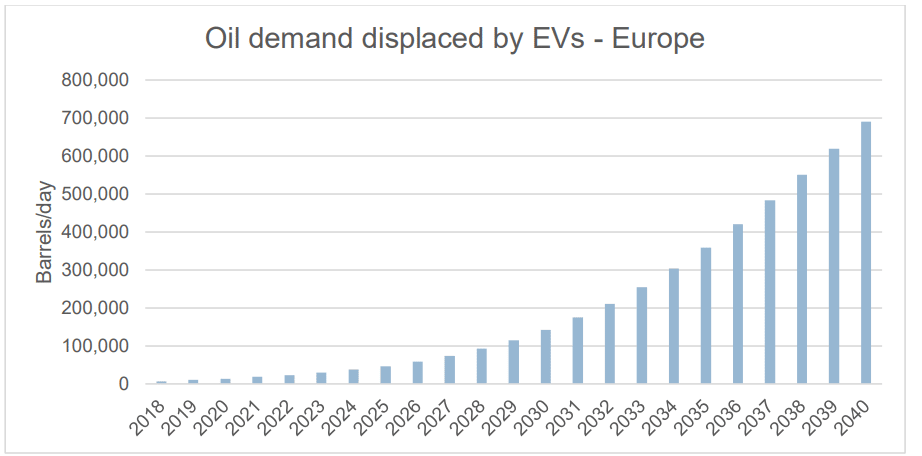
Figure 19: Oil demand displaced by EVs in Europe. Source: BAML
This data is very approximate and other estimates show a large range. The 50,000 number above was calculated by multiplying the 5 million EVs on the road today by a rough guess of 0.1 barrels of oil equivalent of energy they consume per day. If this metric were used instead, based on projected EV penetration, EVs in Europe would displace 1.2 million barrels per day in 2040, almost double the number stated in the above graph. To contextualise this, global oil demand is projected to peak by around 2030 according to BAML (Figure 20) 25. Using their data and a guide of how much of global oil demand goes to Europe (about 6.6%26 in 2018 but this
- 2 Seeking Alpha:
https://seekingalpha.com/article/4231954-electric-vehicles-impact-future-oil-demand - 3 The Street:
https://www.thestreet.com/markets/commodities/oil/electric-vehicles-and-the-future-of-oil-14867849 - 4 Wood Mackenzie:
https://www.woodmac.com/news/automotive-sales-trends-suggest-higher-oil-demand-in-medium-term/ - BAML: Oil Gusher #286
- Enerdata: https://yearbook.enerdata.net/oil-products/world-oil-domestic-consumption-statistics.html
share is likely to decrease as renewables become more prevalent), this would
translate to 10-20% of European oil demand being displaced by 2040.
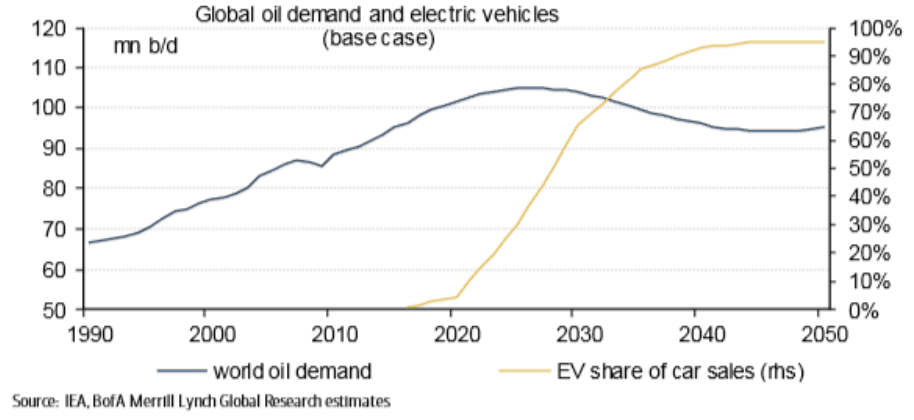
Figure 20: Global oil demand and EV share of car sales. Source: BAML
4.2 Value from Marketing
Beyond oil demand itself, an important part of oil-company earnings comes from Marketing – retail surrounding their filling stations. If the importance of filling
stations diminishes as projected earlier and ride-sharing becomes more ubiquitous, this stream of earnings may come under pressure .
The development of new mobility services – car-pooling, rental, ride-hailing – are continuing to threaten oil companies’ marketing. Each of these markets is growing at double digit CAGRs (except for car rental, which grew at 4% from 2000-2016)25. It is projected to increase to 130mn vehicles by 2030 (Figure 21) and could imply 1.4 trillion fewer miles travelled per year in 203025. This will factor in to lost earnings at filling stations.
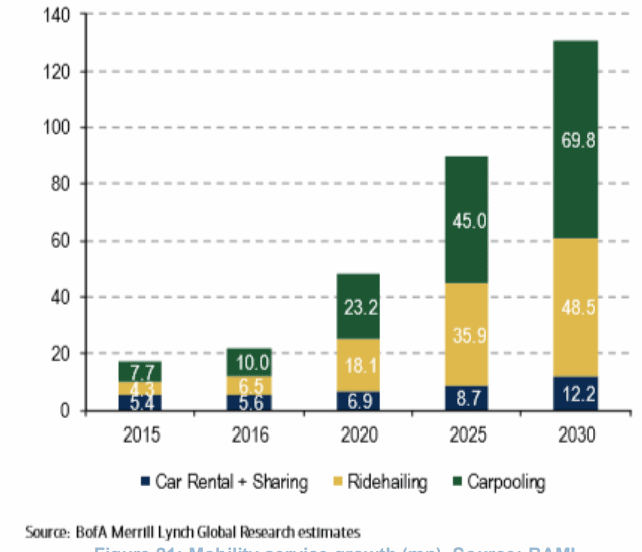
Figure 21: Mobility service growth (mn). Source: BAML
According to BAML, Marketing accounts for up to 25% of some oil companies’ enterprise value (Figure 22) and plays a disproportionately large role in generating free cash flow and dividend cover (Figure 23)27. They estimate Marketing torepresent >$100bn in value across the 7 oil companies in Europe shown below25.
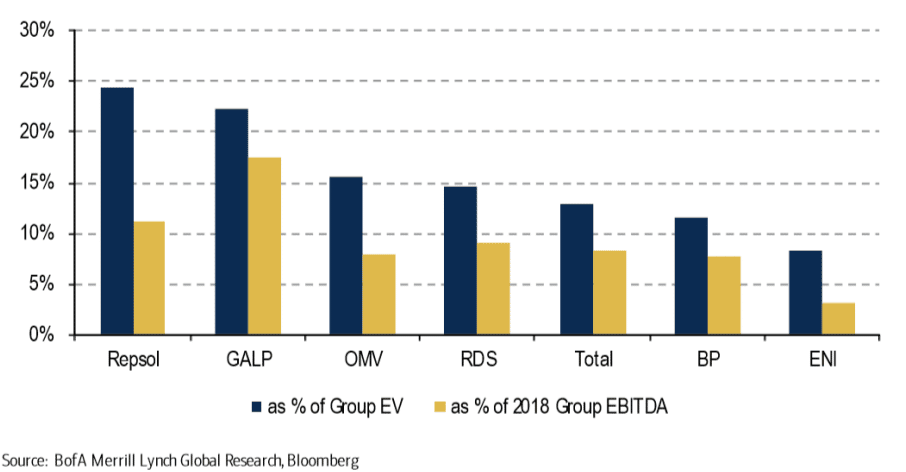
Figure 22: The value of Marketing on earnings. Source: BAML
- BAML: Oil Gusher #261
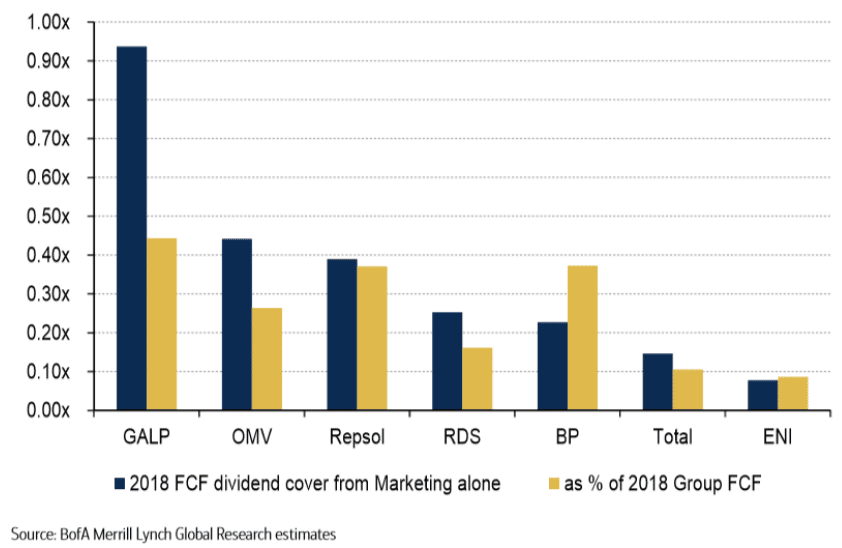
Figure 23: The value of Marketing on free cash flow. Source: BAML
4.3 Oil Company Responses
Oil companies are slowly entering this space to try and mitigate some of this impact.
BP
In January 2018, BP announced a $5mn investment into Freewire, a maker of mobile EV chargers that feature rapid charger technology25. Due to this, BP stated
that it would add rapid charging points at 50 UK filling stations during Feb-March 2018 so that 96% of UK drivers can drive in any direction and be within 50 miles of a rapid charger25. It also claims to own the largest charging network in the UK, following its acquisition of Chargemaster last year for £170mn, with a total of 6,500 charging points28.
However, based on the idea that filling stations will become a minute part of the charging network, the mobility chargers by Freewire may not be a significant
advantage in the long term. Chargemaster, which supplies to homes and public areas, is a better long term investment.
Royal Dutch Shell
In 2017, RDS acquired NewMotion, which delivers smart charging to homes, businesses and public parking spaces25. Over 30,000 chargers have been installed in Europe so far and customers also use an app and charging card to give them access to over 50,000 charging points25. This acquisition may be particularly
beneficial as it gears RDS towards the home/public parking charging network as opposed to filling stations – the best long-term play according to the analysis above.
Eni
Eni launched a car sharing scheme called ‘Enjoy’ in 2013, allowing customers tolocate and book vehicles via an app and leave them in any parking space in a
given city25. The service is currently in Italy and has >500,000 registered users and more than 2,000 cars – it is seen as one of the key threats to Uber in Italy25. It has also collaborated with Italian utility company Enel since 2013, rolling out EV chargers across Italy25.
Although oil demand is unlikely to be materially affected by EVs in the near future, it is probably going to see a sizeable chunk of demand being displaced in the long term. While there are myriad estimates as to when peak oil will occur, there is almost no one who is doubting that it will happen at all and questioning EV’s role in it. The charging behaviour outlined in previous sections does not bode well for the Marketing section of these companies either and it is could put a large portion of earnings at risk.
5Batteries
5.1 Cost Reductions
As the charging network and grid infrastructure help to facilitate EV uptake, suppliers of the components in EVs will also need to meet demand and improve efficiency to quell concerns over price and range (Figure 24).
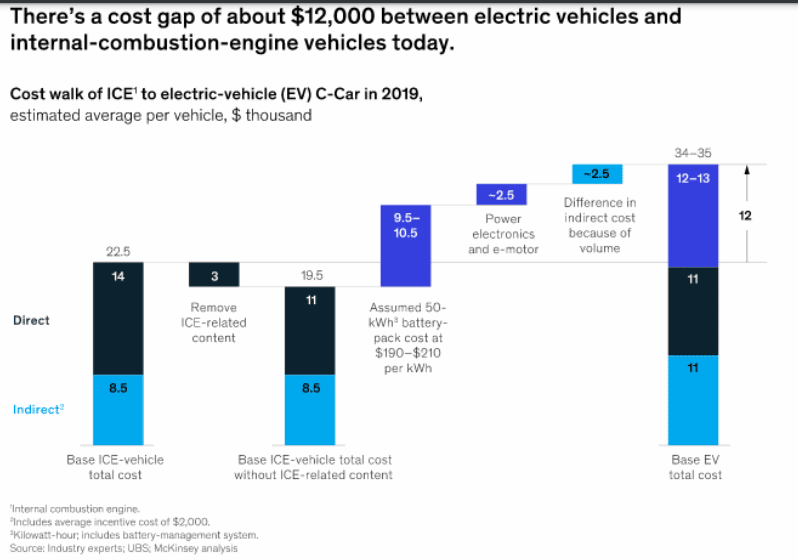
Figure 24: Cost difference between EVs and ICE vehicles. Source: McKinseye: BAML
By far the most significant player in the journey to cost parity with ICE vehicles is the battery29(Figure 25). The battery makes up about a third of the cost of an EV30 and, although this proportion is getting smaller, it will likely remain its single most expensive component. Lithium-ion batteries (LiB) are the best option for energy storage in an EV – their energy density, size and cost make them the battery of choice for all EV manufacturers.
- Bloomberg NEF:
https://about.bnef.com/blog/electric-cars-reach-price-parity-2025/ - Bloomberg:
https://www.bloomberg.com/opinion/articles/2019-04-12/electric-vehicle-battery-shrinks-and-so-does-the-total-cost
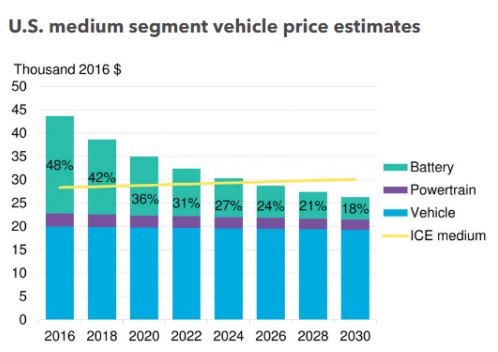
Figure 25: Cost parity forecasts. Source: Bloomberg NEF
There are two competing factors affecting LiB prices – first, there ar improvements in technology. A battery cell consists of an anode, cathode and electrolyte with the cathode making up about 25% of the battery cost31 . Alongside lithium, the main materials in the cathode are nickel and cobalt – this has led to
nickel-manganese-cobalt (NMC) and nickel-cobalt-aluminium (NCA) batteries (both still containing lithium) being the preferred option for EV battery
manufacturers. The trend has been to increase the proportion of nickel in the cathode, as this increases energy density and hence range; this, coupled with the growing economies of scale enjoyed by manufacturers, is instrumental in the continuing cost reduction of LiBs.
Since 1991, LiB costs have fallen by 96% – a 12% compound annual decline for 27 years32 (Figure 26). The 2 main sizes of LiB – small cylindrical (used in everyday consumer electronics like remotes etc) and large (used in EVs) – have historically had an energy density and cost disparity but this is slowly being narrowed. Current cost and energy density stand at around $150-200/kWh and 250-300Wh/kg. These figures stood at around $5000/kWh and 55Wh/kg in 199032 (Figure 27).
- McKinsey: Lithium and cobalt
https://www.mckinsey.com/~/media/mckinsey/industries/metals%20and%20mining/our%20insights/lithium%20and%20cobalt%20a%20tale%20of%20two%20commodities/lithium-and-cobalt-a-tale-of-two-commodities.ashx - Bernstein: Electric Revolution 2019
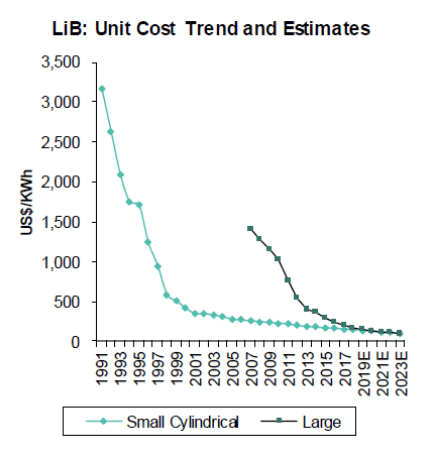
Figure 26: Declining LiB costs. Source: Bernstein
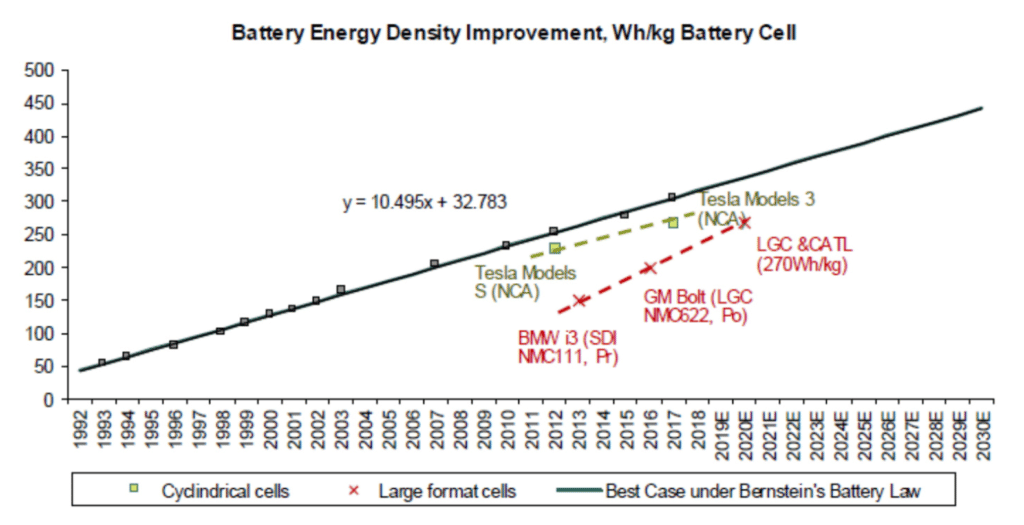
Figure 27: LiB energy density improvements. Source: Bernstein
5.2 Supply Shortages
The second factor is the shortage of supply (Figure 28). In terms of commodities, lithium is expected to meet demand comfortably in the medium term31, but fall short in the long term (past 2030) – Recurrent Investment Advisors suggest that 1.5- world scale lithium mines will be required to be built every year in the 2030s33. Cobalt and nickel are expected to see bottlenecks sooner31 – regional issues in
- Recurrent Investment Advisors: From Gasoline to Grid
the Democratic Republic of Congo (a monopoly on cobalt mining) as well as depressed prices for nickel mean that McKinsey expect shortages in the middle of the next decade34.
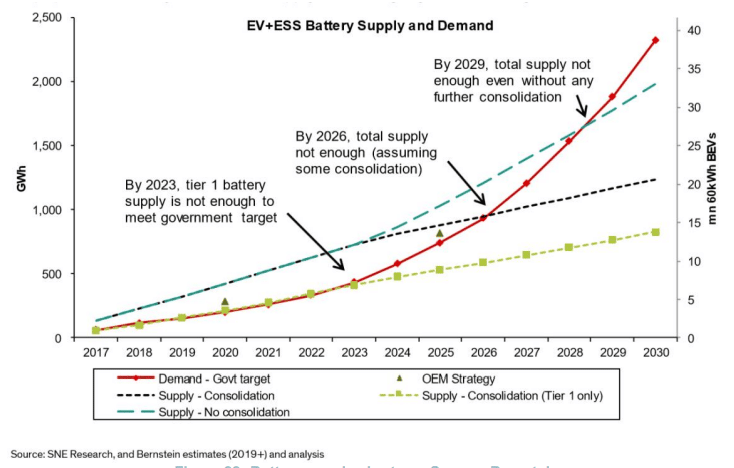
Figure 28: Battery supply shortage. Source: Bernstein
This graph is slightly aggressive in its EV penetration and demand estimates compared to the BAML forecasts but gives a rough guide to the scale of demand.
Furthermore, an issue arises when analysing the separation of the Chinese and ex-Chinese battery markets: the majority of EVs sold in China use Chinese
batteries and very few Chinese suppliers sell batteries oversees32. China is by far the biggest player in the battery market – it is the largest importer of every major commodity in the cathode32. This exacerbates the already short supply in ex-China suppliers. Estimates from Bernstein show combined capacity from ex-China suppliers will reach 160GWh by 2020 and 425GWh by 2025. As ex-China demand reaches about 400GWh by 2025, the ex-China battery market is likely to tighten in the middle of the next decade32. What this has resulted in is consolidation amongst the ‘Big Five’ battery manufacturers – Panasonic, Samsung SDI, LG Chem, BYD and CATL – whose market share has increased from 43% in 2015 to 54% in 201832 (Figure 29).
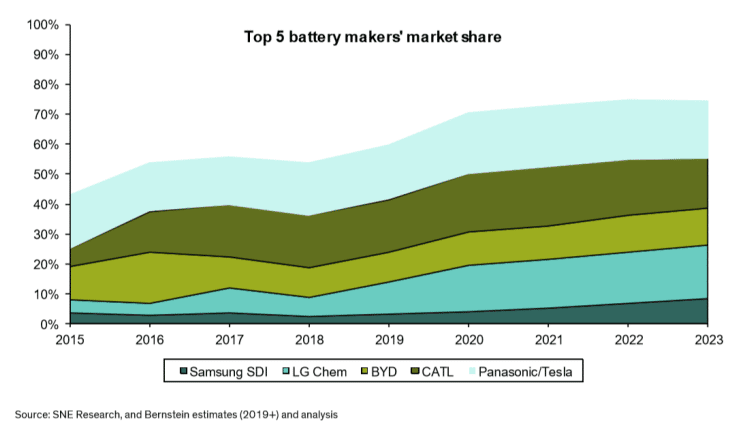
Figure 29: Consolidation of the battery manufacturing industry. Source: Bernstein
5.3 Solid-State Batteries
While these concerns remain predominant, a look into the longer term future of battery technology suggests that solid state batteries will bring about the largest
improvements: these are batteries that use a solid electrolyte (such as oxides or sulphides) to connect the anode and cathode as opposed to the liquid electrolytes used today. Not only does it promise significantly higher energy density, it will also be safer, cheaper and enable ultra-fast charging (under 10 mins)35.
However, reports clearly state that this will not be a significant type of battery till mid-late 2020s32. Along with the required technological improvements, a key reason for this wait centres on the supply chain and manufacturing process. In order for a hardware heavy technology like batteries to gain mass adoption, the materials, manufacturing and distribution need to be both available and economical. It took 11 years for LiBs to go from invention to commercialisation and a further 20 years for them to start challenging lead-acid batteries for larger applications32. While this seems like a long time, it is actually much faster than the historical, multiple decade time lags between invention and commercialisation. These time lags are continuing to decrease, hence why it is expected that solidstate batteries should be mass produced by the end of the next decade. Until then, LiB will remain the dominant technology with advances coming via increases in nickel proportions, pairing NMC with NCA technology and improvements in anode materials – the anode is currently made out of graphite but silicon is becoming an encouraging possibility32 . Toyota (partnered with Panasonic), Samsung SDI and
- 5 Bernstein: The Battery Bible
LG Chem are ahead in terms of the number of patents they’ve filed and Samung SDI has made strong inroads into solid state recently32.
In contrast to the charging network and grid infrastructure, batteries will be put under strain by EVs. It is unclear as to when or if supply shortages will overcome
efficiency improvements and the price drops will cease. Solid-state technology holds immense promise, but the time at which it will be economically viable let alone mass adopted is a long way away.
6Conclusion
EVs will have a wide and significant impact on industries beyond auto manufacturing. Although their hype must be put into perspective, they are eventually likely to dominate the economics of companies and the everyday lives of individuals. Although charging networks and grid improvements are unlikely to prove too difficult for utility companies, they will be essential for an EV uptake and hold ups on either a company or governmental level will certainly hinder the mass
adoption of EVs. In particular, the nature of charging behaviour and grid balancing solutions could have important consequences on industries such as Big Oil – although it will not be threatened by EVs soon, it is starting to look more seriously into entering the sphere amidst more worrying long term possibilities. And one of the key factors in cost reduction and range increase, the battery, is projected to meet supply difficulties within the next decade, potentially slowing down the crucial cost per kilowatt decreases needed for cost parity with ICE vehicles. As with any ‘revolutionary’ technology, it is sure to bring out the best in human innovation as we grapple with the looming threat of irreversible climate change. Change is certainly coming; it might just take some time.
7Appendix: How green is an Electric Vehicle?
In order to analyse the relative carbon footprint of EVs, we split it into two categories: where the EV (in particular, the battery) is manufactured and where
the EV is driven. On the first point, there is a large spread in the amount of CO2 emitted depending on the country of origin (Figure 30) due to the differences in
electricity makeup in each country. Chinese 60kWh battery packs emit 4.3 tons of CO2 (including mining) whereas UK batteries are closer to 2.5 tons.32
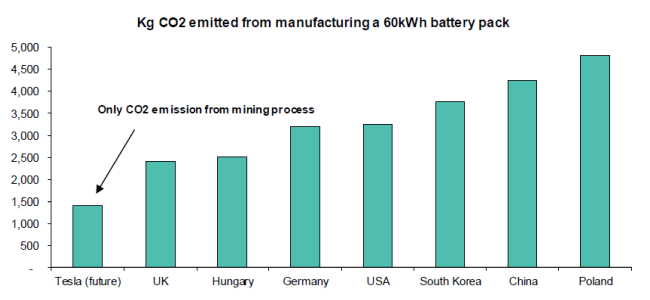
Figure 30: CO2 emissions from battery manufacturing by country. Source: Bernstein
The other impact that national electricity makeup has is on the emission of CO2 whilst the vehicle is on the road. Norway emits negligible CO2 (they have 98% of
their energy come from renewables) whereas Poland emits about 0.8kg/kWh32. On a 15,000km annual driving range, an EV emits 0.5 tons of CO2 in renewable rich countries like the UK and Norway and 1.5 tons in China; however, this remains markedly lower than the 3 tons emitted by ICE vehicles (Figure 31)32.
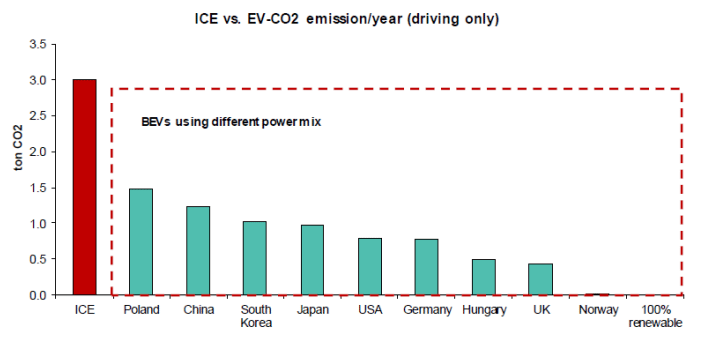
Figure 31: CO2 emissions from driving by country. Source: Bernstein
Overall, this means that it will take an EV manufactured in the UK on UK roads about 2.4 years to breakeven on CO2 emissions with an ICE vehicle on UK roads32 (Figure 32). This moves to about 12 years for Chinese EVs driven in China32 (Figure 33). In a full 240,000km life cycle, EVs come out well ahead in almost every situation32 (Figure 34). Even if margins for error are taken into account, only the few worst polluting countries remain on the fence in the comparison. The changes to the power mix in each country is set to increase this difference in emissions as well – the incremental power mix in the majority of countries is a lot more renewable based than the existing power mix32 (Figure 35).
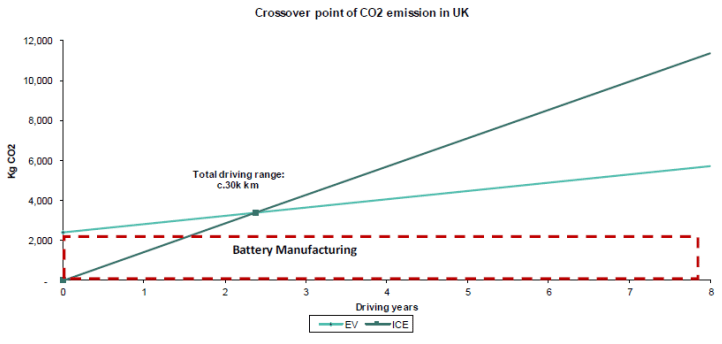
Figure 32: CO2 crossover point – UK. Source: Bernstein
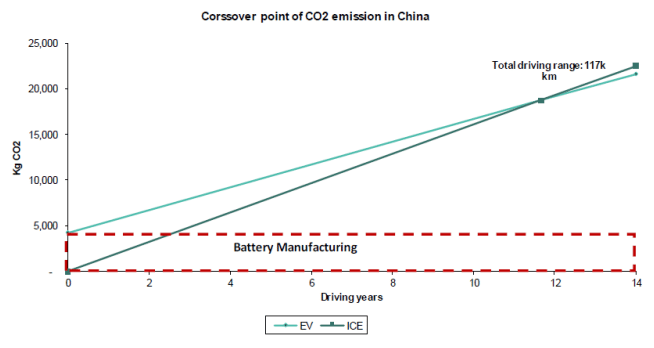
Figure 33: CO2 crossover point – China. Source: Bernstein
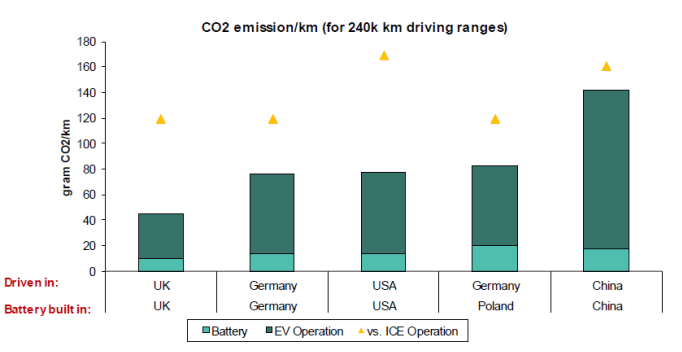
Figure 34: CO2 emissions comparison over a full lifetime. Source: Bernstein
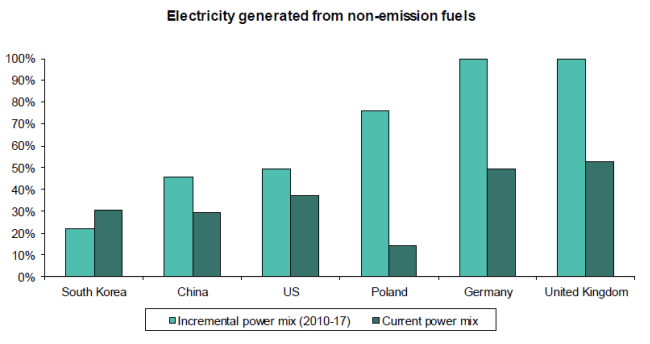
Figure 35: Changes to the power mix by country. Source: Bernstein